
Case studies · Automotive, metal components
Weld quality AI: 86% fewer defective parts
Weld image analysis and forecasting warn before the process drifts out of tolerance.
Client: Global automotive parts manufacturer · Industry: Automotive, metal components · Solutions: Visual quality inspection
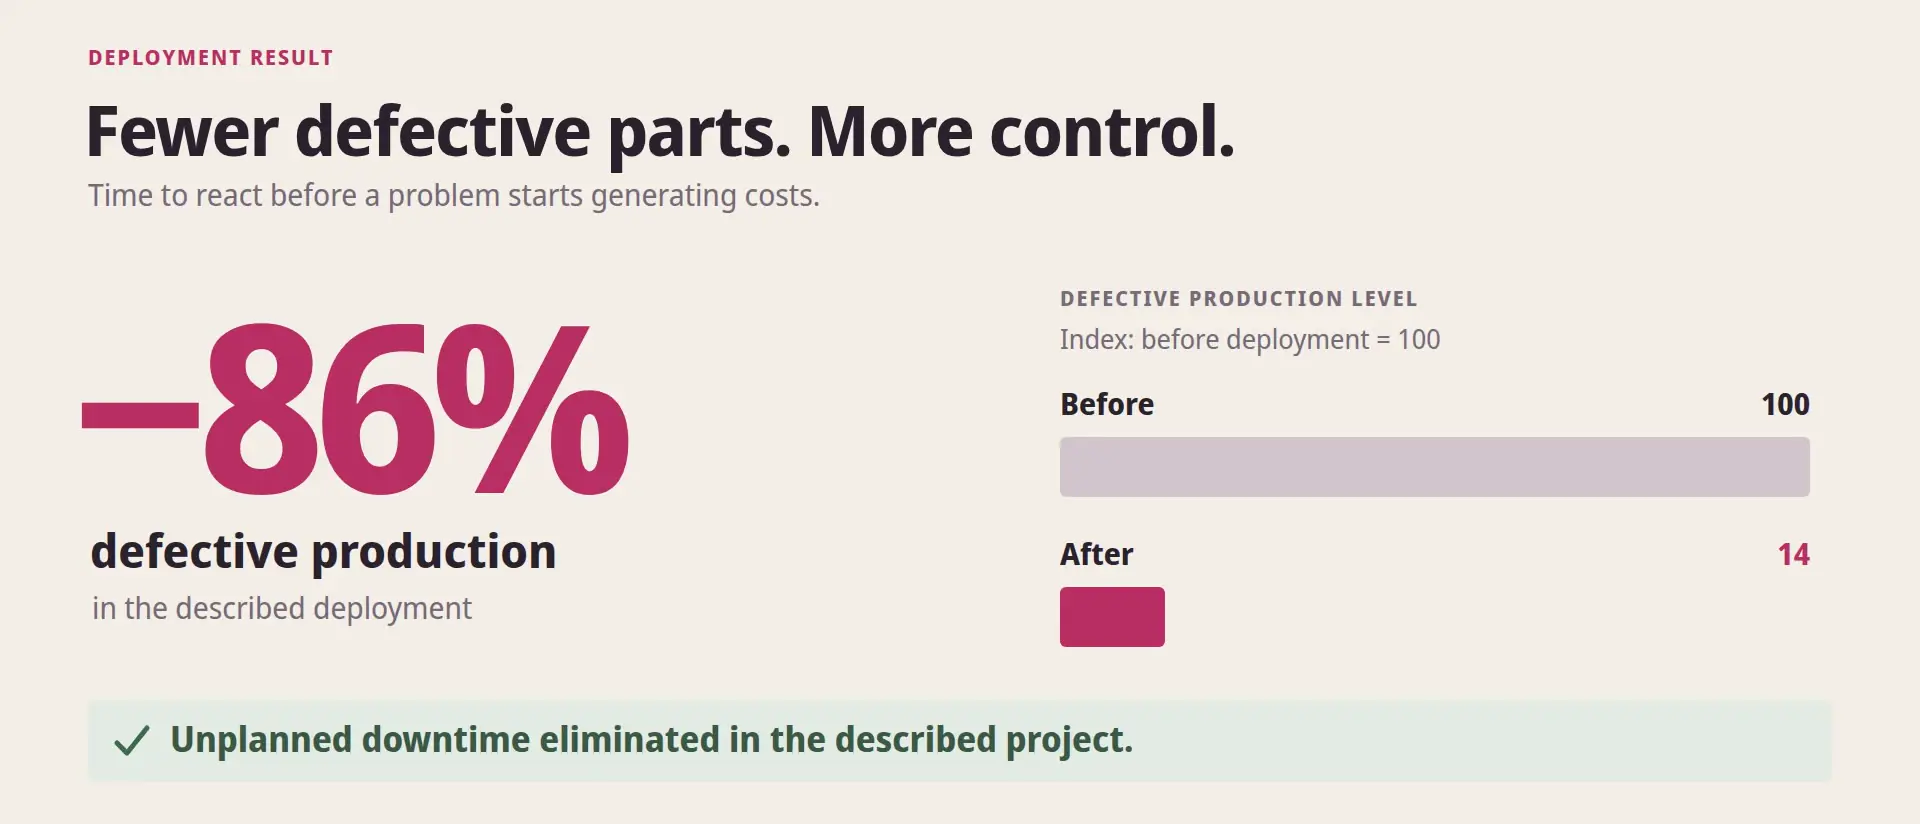
fewer defective parts
unplanned downtime from process drift after go-live
cost of 8 hours of defective production at this plant
The challenge
In this plant, eight hours of defective production cost about 200,000 euros. Every weld was photographed under a microscope and inspected, but machine settings drifted slowly and each new weld strayed further from the standard.
By the time the problem was obvious, defective parts had already been made. The data to see it coming existed, but it was scattered across thousands of spreadsheets.
01 / Data layer
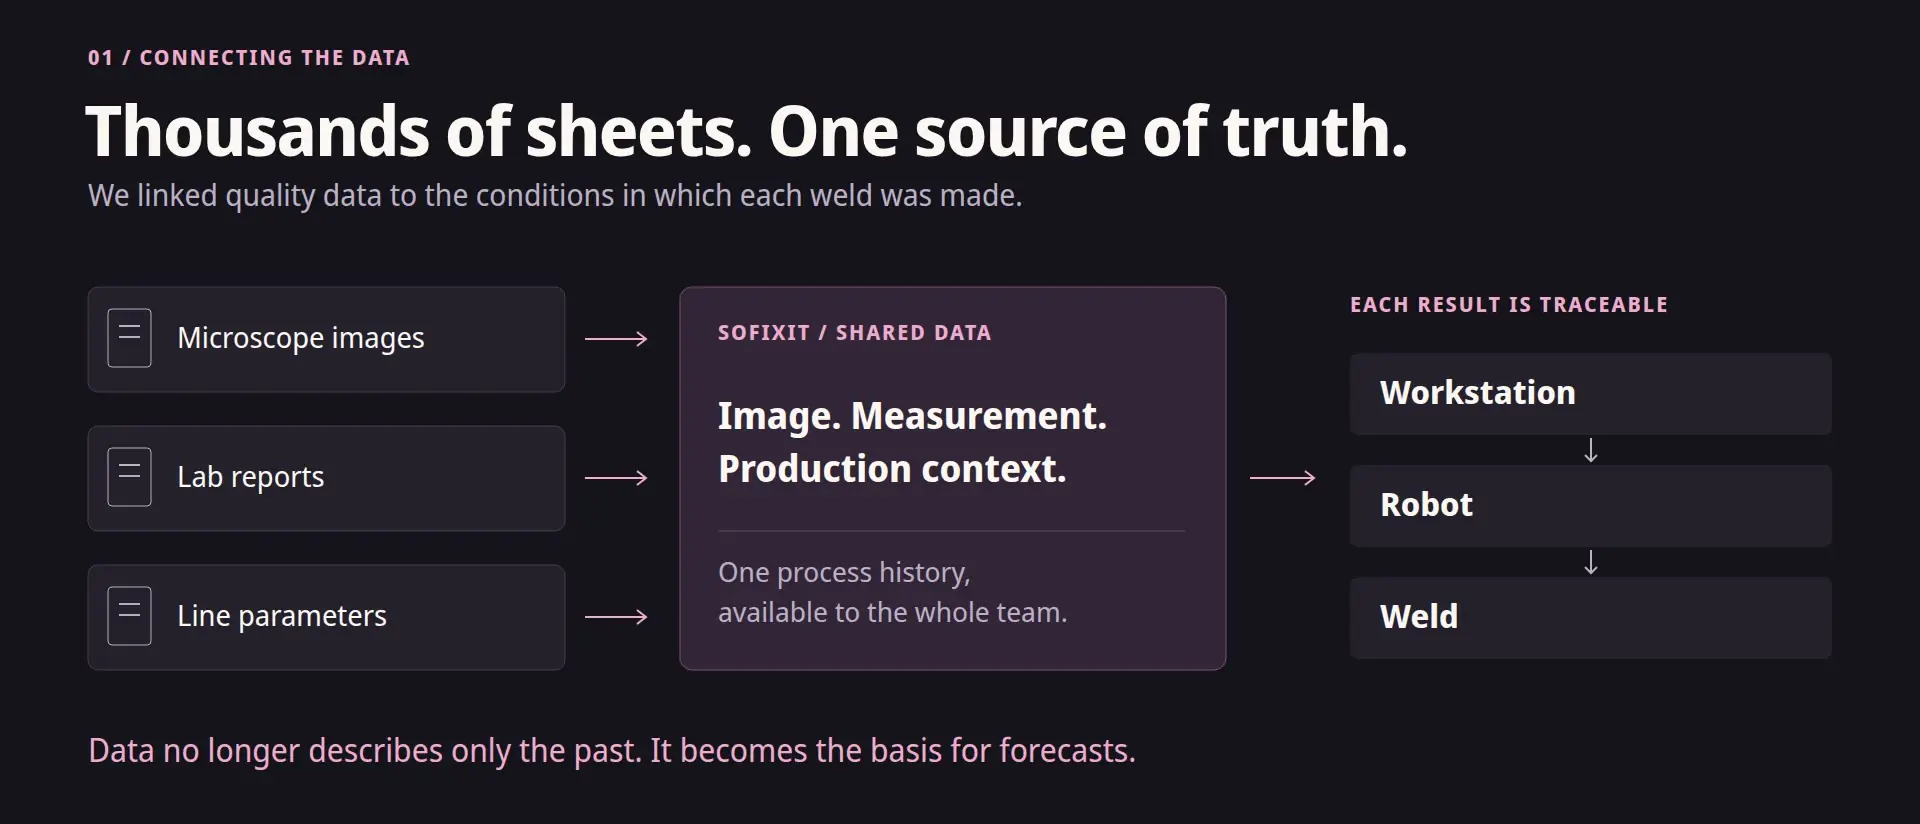
Microscope images, lab results and production line data linked into one shared source.
Every result tied to its workstation, robot and specific weld, so a deviation points to a place where the team can act.
02 / AI layer
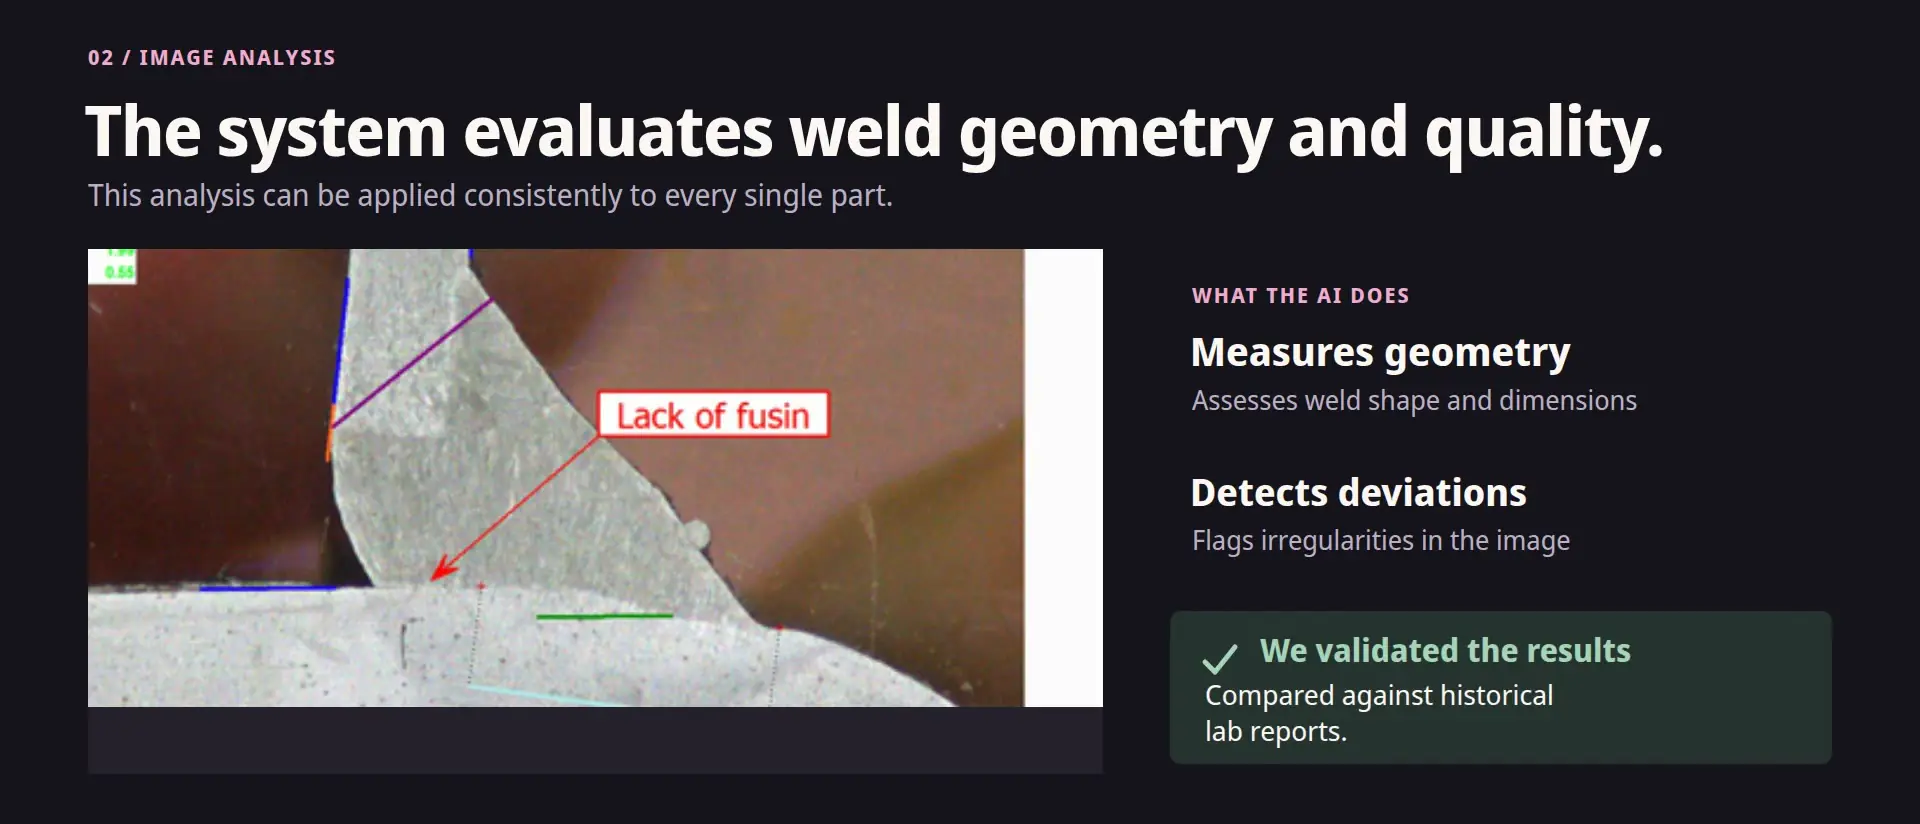
Image analysis measures weld geometry and detects irregularities; its results were checked against historical lab reports, which made quality assessment automatic and repeatable for every part.
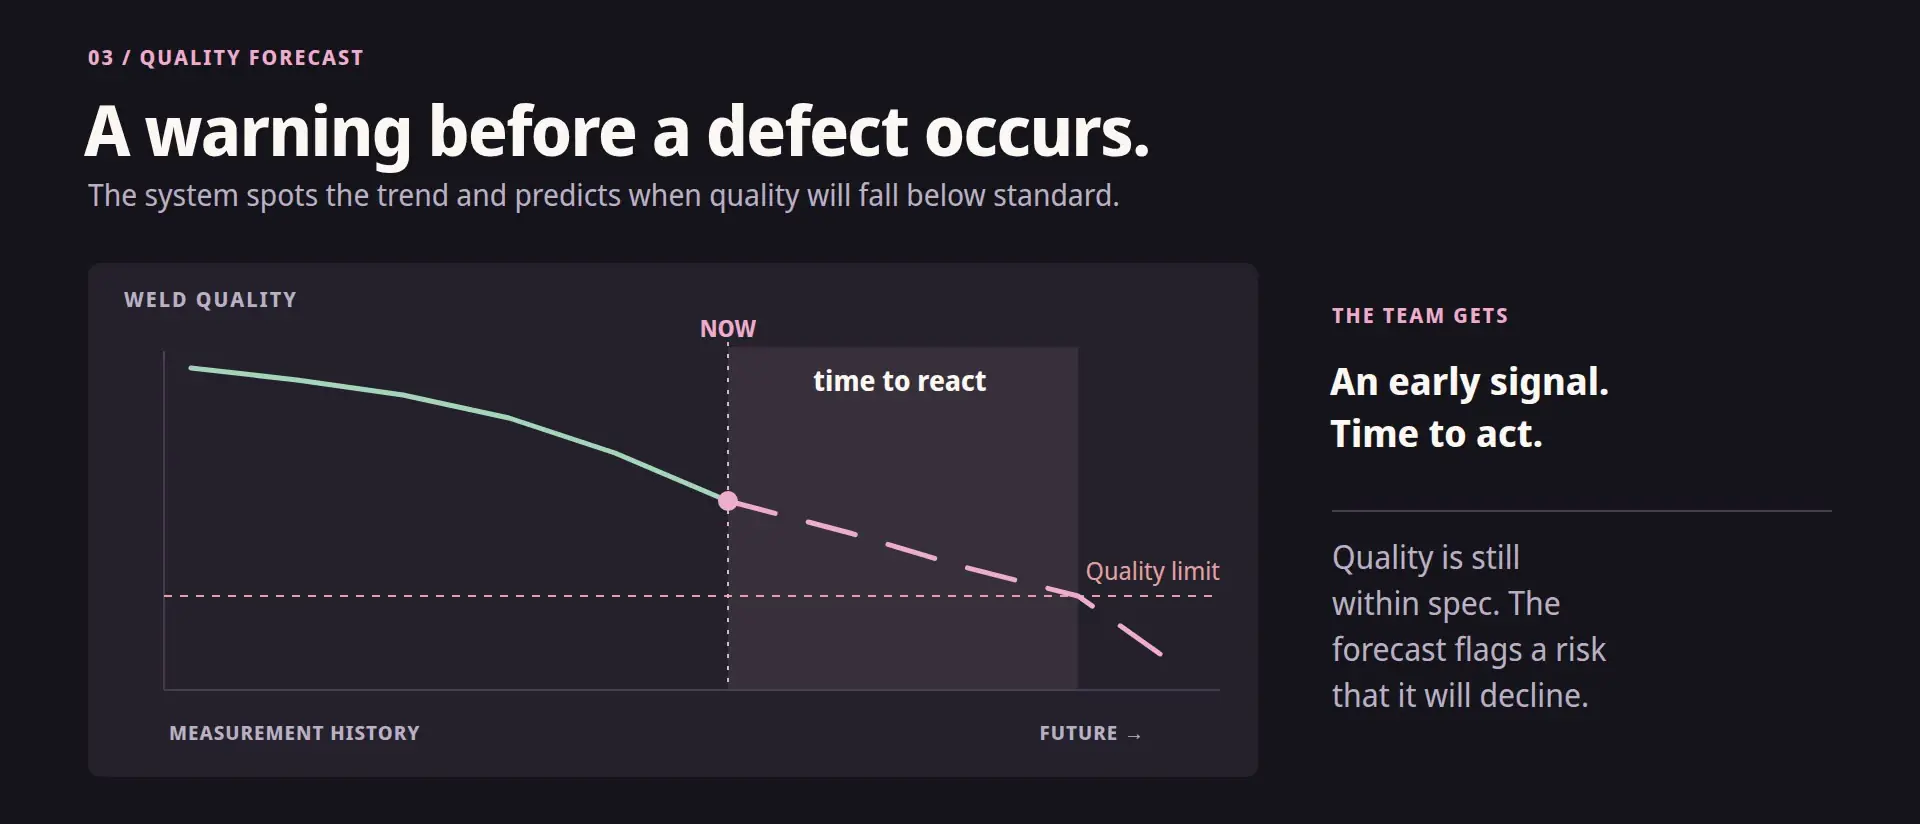
Forecasting turns a series of measurements into a trend and predicts when quality will fall below standard, so the team is warned before the first defective part is made.
The project, scene by scene
The frames come from our film about this deployment.
01 / 09
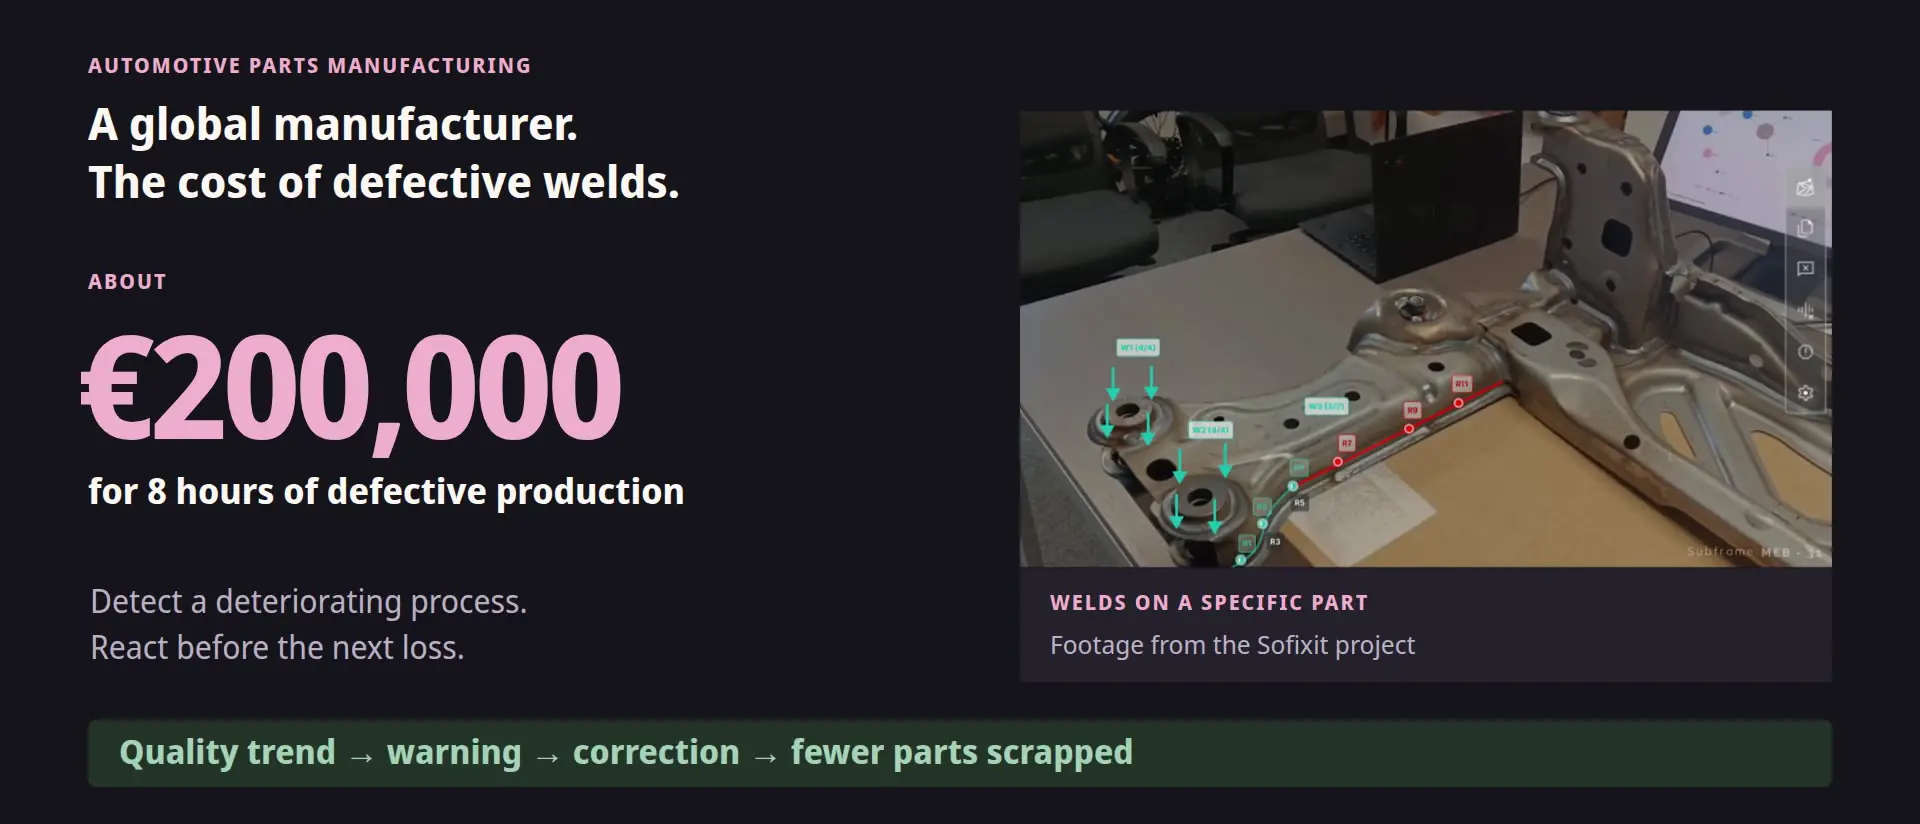
€200,000 at risk: why react earlier
In this plant, eight hours of defective production costs about two hundred thousand euros. At a global automotive parts manufacturer, Sofixit combined data and weld analysis to give early warnings. The goal: correct the process before more parts end up as scrap.
02 / 09
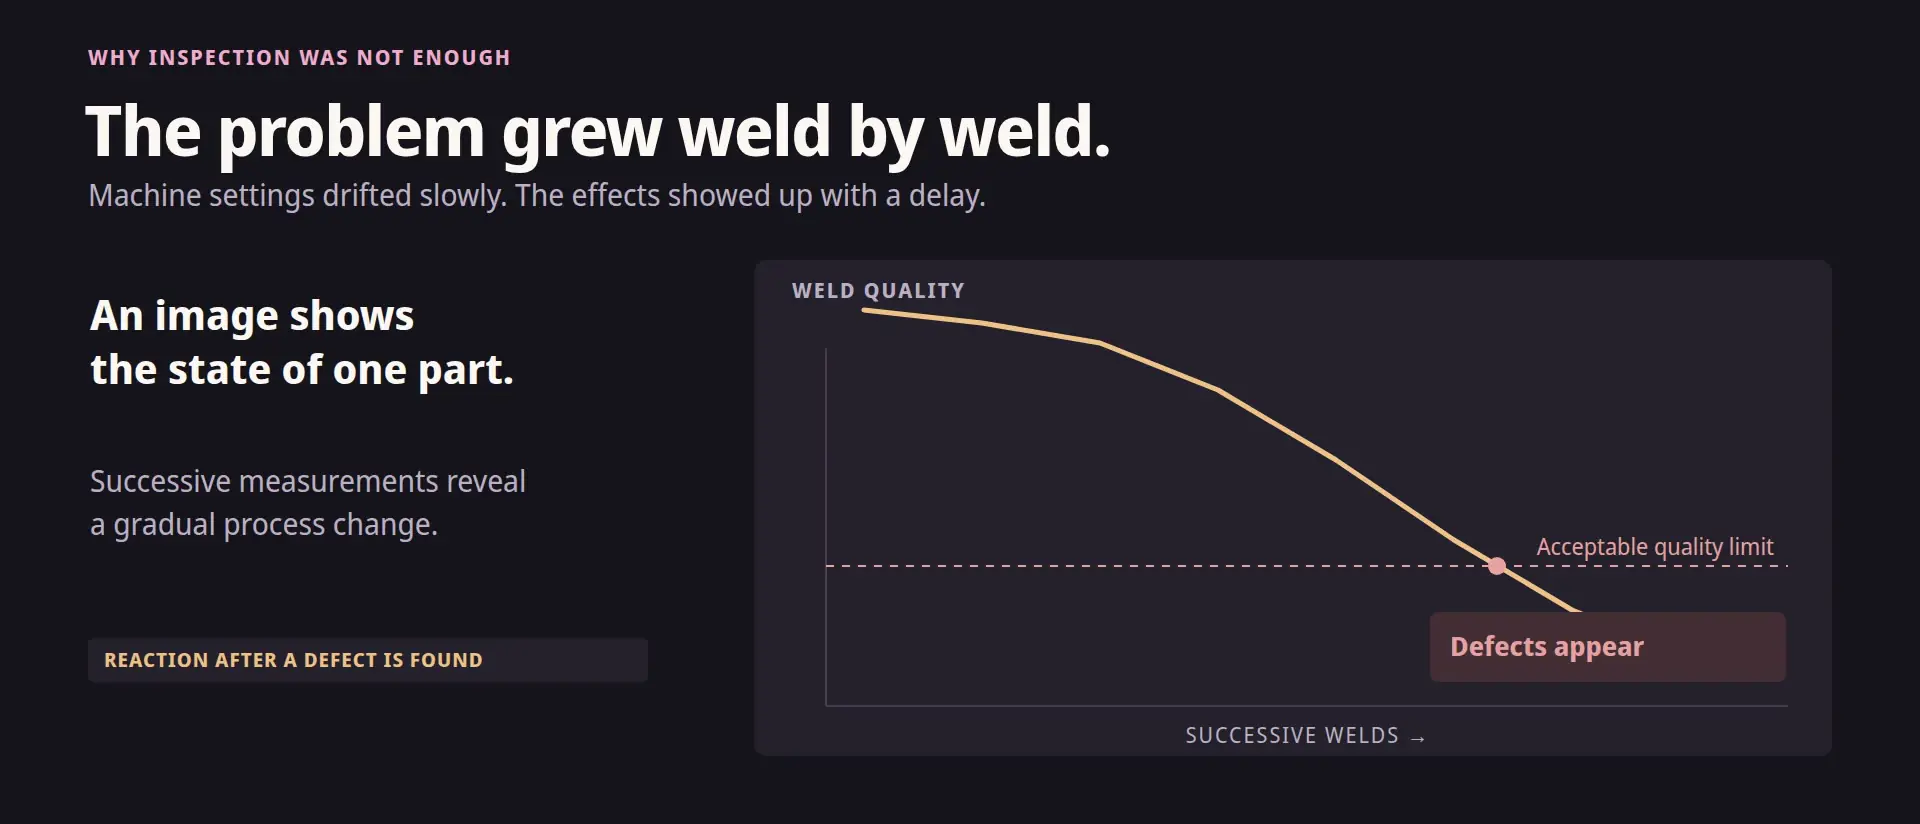
Why defects occurred
Every weld was photographed under a microscope and inspected. But machine settings drifted slowly. Each new weld strayed further from the standard. By the time the problem was obvious, defective parts had already been made.
03 / 09
Connecting the data
The data existed but was scattered across thousands of spreadsheets. Sofixit linked microscope images, lab results and line data. Each result was tied to its workstation, robot and specific weld. The result: one shared source of information.
04 / 09
How AI analyzes a weld
We built a system that analyzes weld images: it measures their geometry and detects irregularities. We compared its results with historical lab reports. As a result, quality assessment became automatic and repeatable, for every single part.
05 / 09
Early warning
A single image shows how a weld looks now. A series of measurements shows where the process is heading. The system caught small deviations and predicted when quality would fall below standard. The team got a warning before the first defective part was made.
06 / 09
Production dashboard: trend and alert
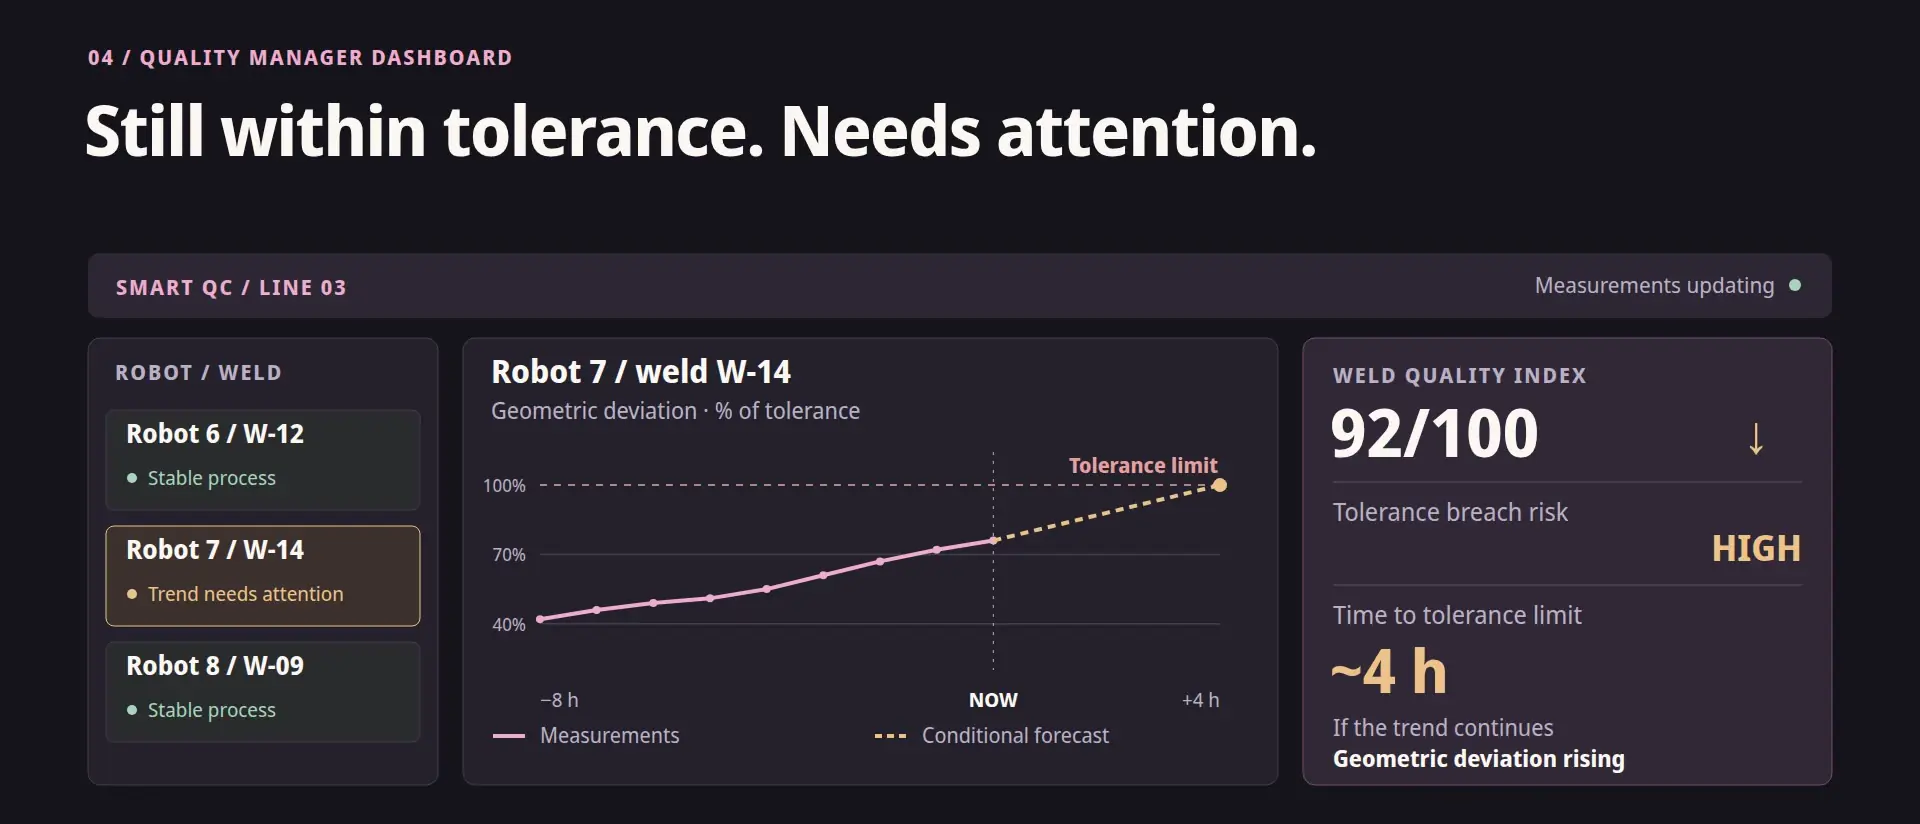
This is what working with the system can look like. The dashboard shows several robots, but robot seven on line three stands out. Its weld quality index drops to ninety-two points. The latest measurement is still within tolerance, but the geometric deviation keeps growing. The forecast shows about four hours until tolerance is exceeded, if the trend continues. An alert appears with the exact location and a recommendation to check the process.
07 / 09
Check, correction and new measurements
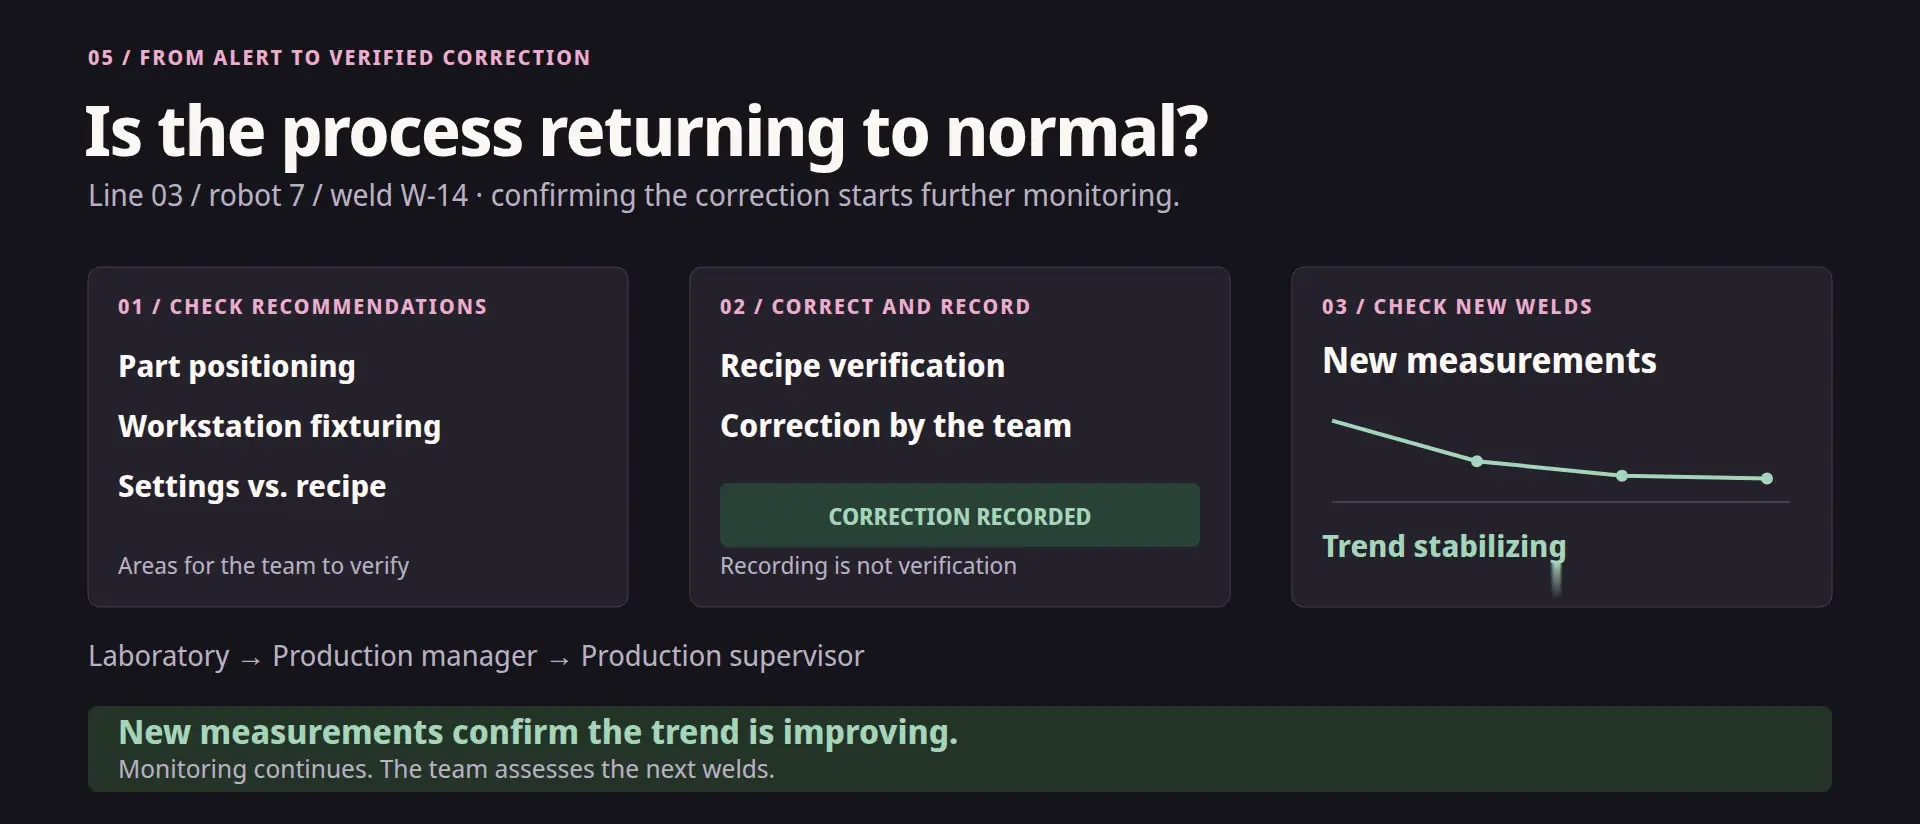
The lab manager opens the alert details. They see the trend, weld images and recommendations: check part positioning, fixturing and robot settings against the approved recipe. The information goes to those responsible for production. The team makes the correction and logs it in the system. That doesn't close the case yet. New measurements show whether the deviation shrinks.
08 / 09
Before and after deployment
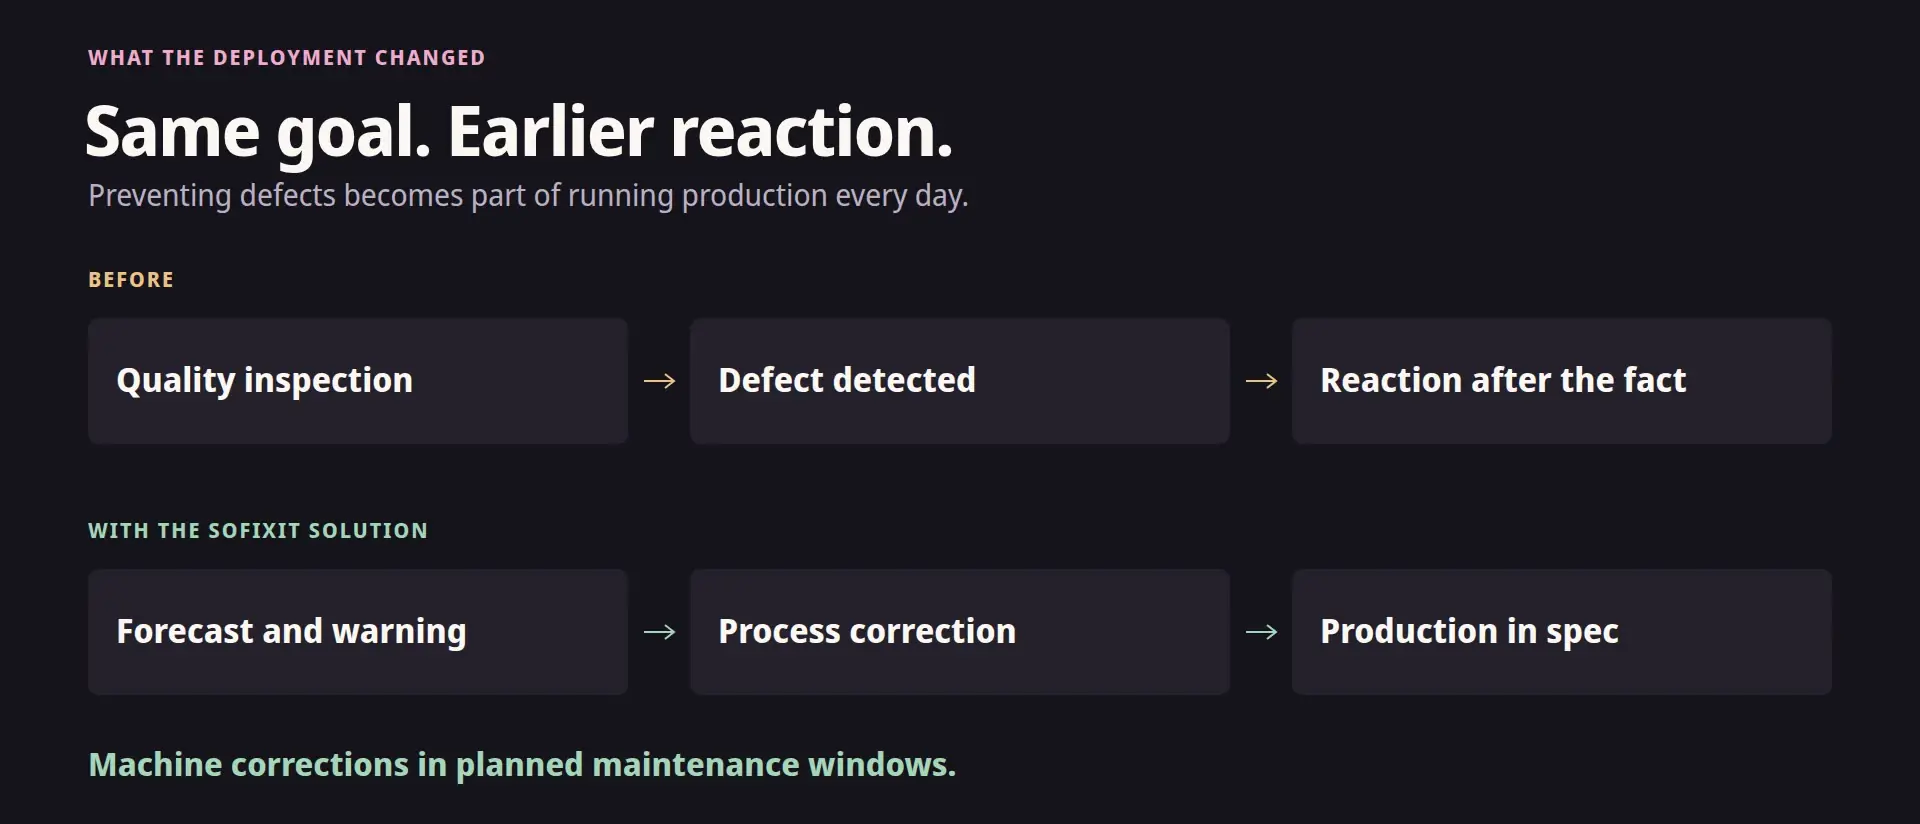
The timing of action changed. Before: inspect, find a defect, react after the fact. After deployment: forecast, warn, and correct before defects appear. Machine servicing could fit into planned maintenance windows.
09 / 09
86% fewer defective parts: time to react
Deployment result: eighty-six percent fewer defective parts and an end to the unplanned downtime described in this project. The value of this change is time to react before a problem starts generating costs. Fewer parts to scrap, and corrections built into the production plan.
Results
- 86% fewer defective parts.
- An end to unplanned downtime from process drift.
- Corrections built into the production plan instead of reacting after scrap appears.
Start with
Fixed scope, fixed price
Pilot on your data
One use case, your real data, a success metric agreed up front. The model works in shadow mode next to people before anyone relies on it.
From
€10,500net
Duration: 6 to 8 weeks
Who leads it: An AI engineer and a data engineer, with an architect overseeing production readiness from day one.
Plan a pilotServices:Data foundation for AIAI engineering into production
Related case studies
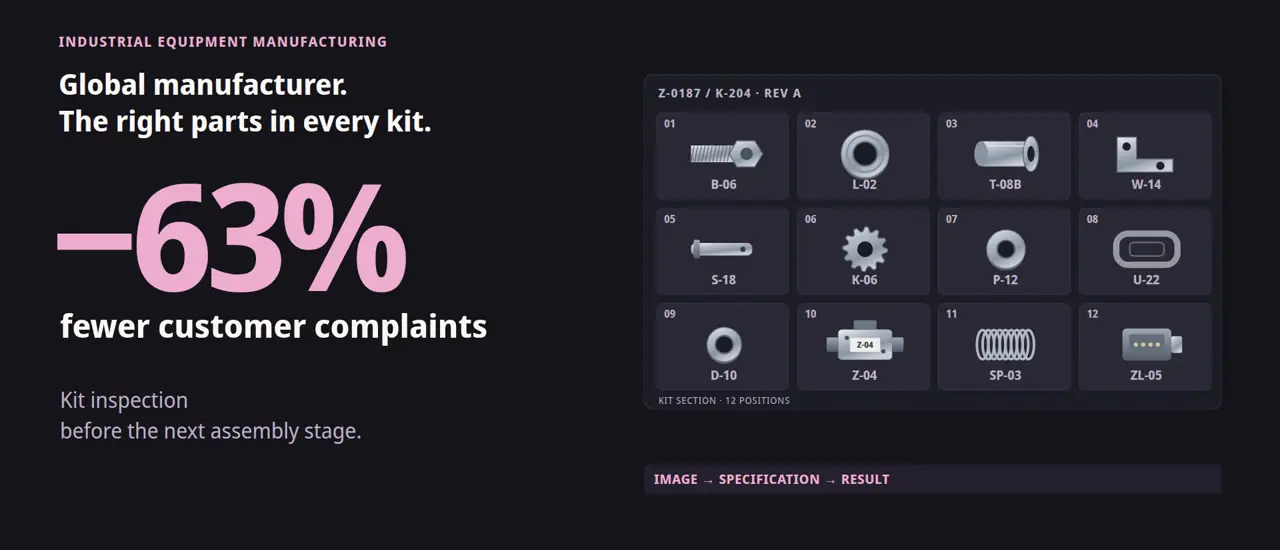
Kit inspection with computer vision: 63% fewer complaints
Global manufacturer of industrial equipment · Industrial equipment manufacturing
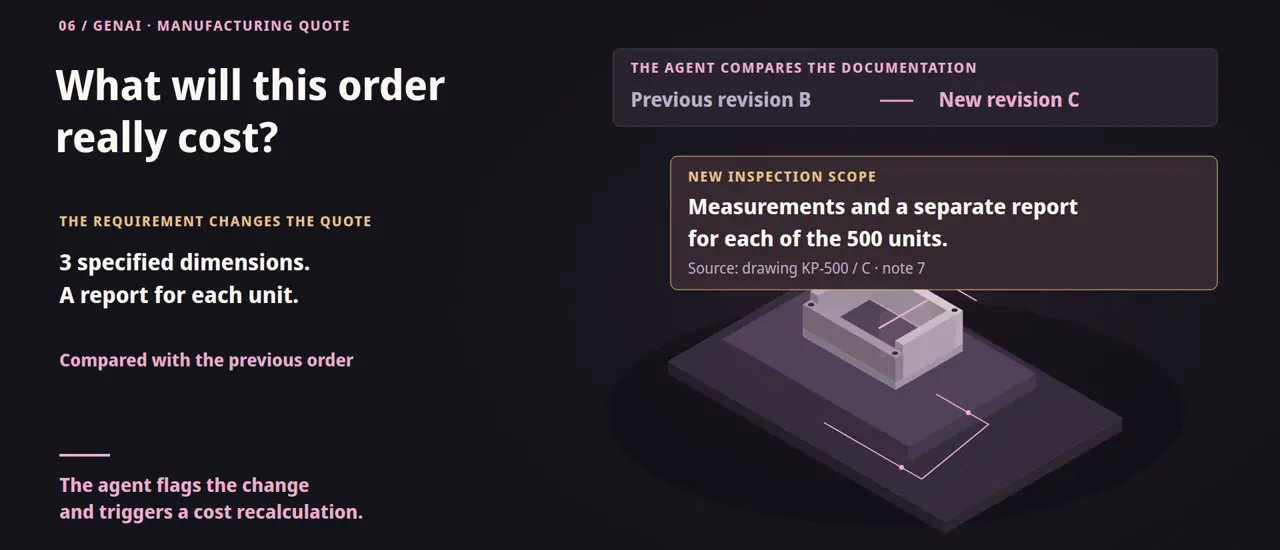
GenAI quoting agent: from 4 to 6 hours to 15 minutes
Manufacturing company · Manufacturing
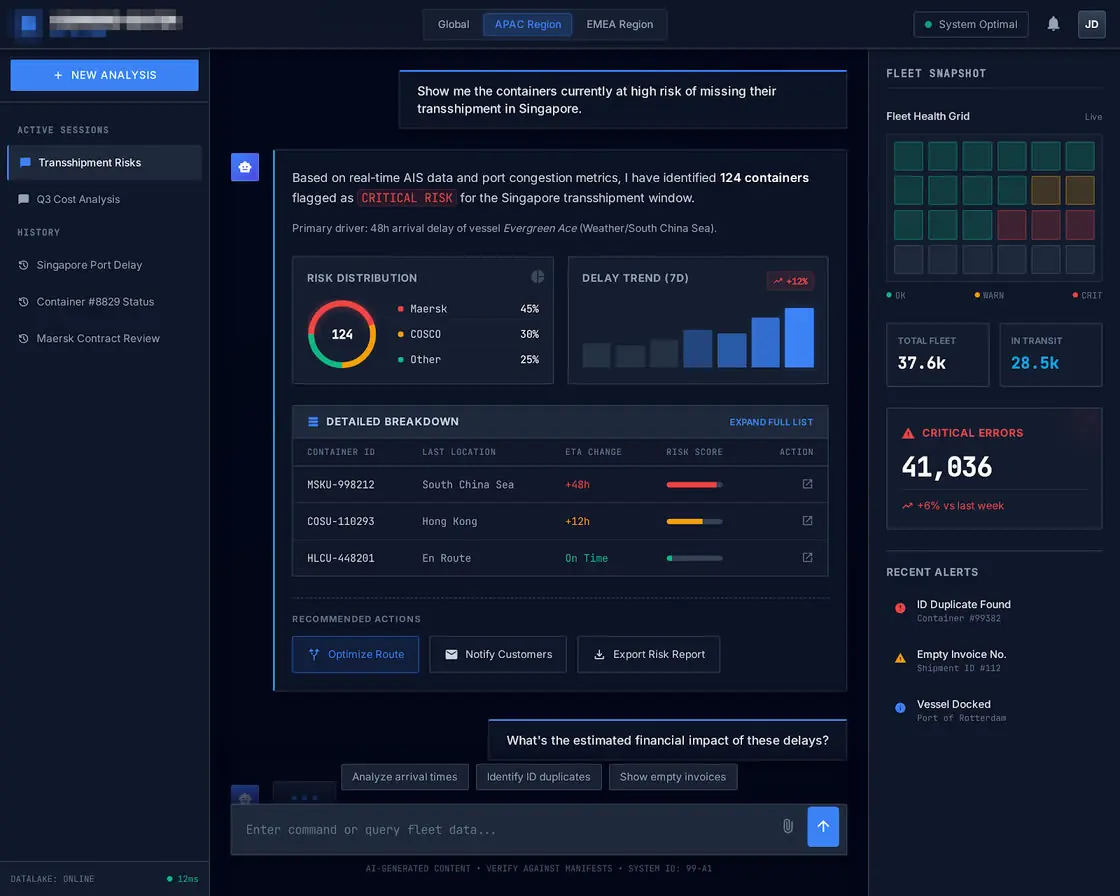
Logistics control tower: 37.6k containers tracked in real time
Global logistics provider, 30,000+ active shipping containers · Logistics
Let's talk about your project
Tell us about your case
Pick one problem.
Show us the data you have.
Let's agree a measurable goal.
Name the process and the data you have. An engineer, not a call centre, gets back to you.
We reply within one business day.