
Case studies · Logistics
Logistics control tower: 37.6k containers tracked in real time
Fragmented carrier data turned into one control tower, with an AI agent that flags delays before they happen.
Client: Global logistics provider, 30,000+ active shipping containers · Industry: Logistics
containers tracked in real time
orders recovered and validated
automated ETA deviation analysis
The challenge
Shipping data arrived from many carriers in different formats, so nobody could see the big picture of the supply chain or which routes kept falling behind schedule.
The goal: one control tower for more than 30,000 active containers, showing bottlenecks in carrier performance and the containers at risk.
How we built it
Phase 01
Foundation and data alignment
Goal
Consolidate fragmented shipping data and clean the logs, so global tracking can be accurate.
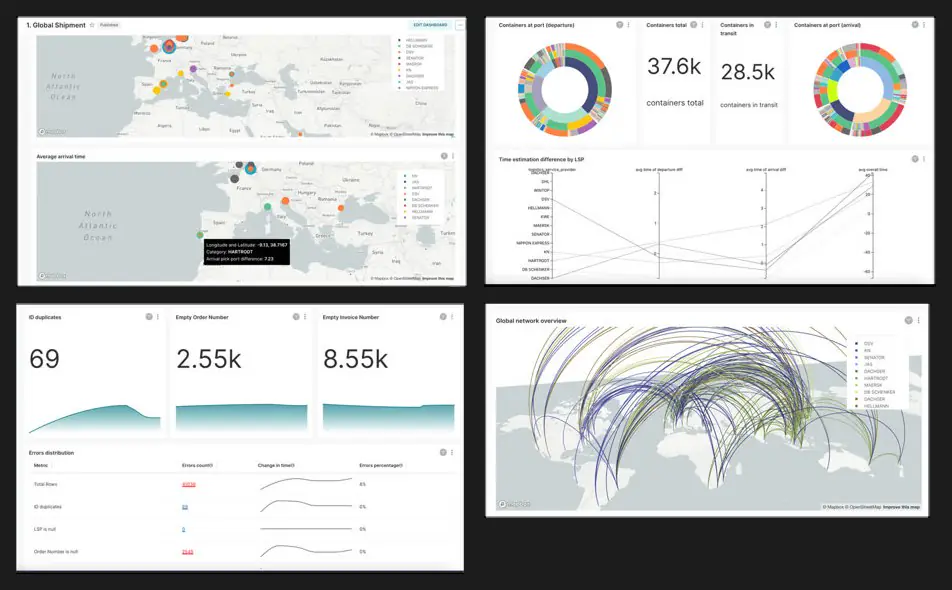
Find the core friction
Different data formats from many carriers made it impossible to see the big picture of the supply chain. The objective: one control tower for 30,000+ active containers that shows bottlenecks in carrier performance.
Clean the manifests
Raw shipping manifests went through data quality filters from day one: 69 duplicate IDs and 2.55k empty order numbers were detected and resolved. Normalisation pipelines turned inconsistent carrier logs into one clean schema.
Prove tracking at scale
A geospatial visualisation engine mapped complex routes: 37.6k containers tracked across the global network, with ETA differences showing which routes consistently lag behind schedule.
Quality gate: data integrity verified, with empty invoice numbers below 3%.
Phase 02
Engineering and product delivery
Goal
Turn raw tracking data into a predictive engine that reduces risk.
Monitor quality in production
A quality layer runs next to the AI and keeps raising alerts such as duplicate IDs or empty invoice numbers, so recommendations stay grounded in verified manifests as volumes grow.
Predict delays
A multi-modal AI agent correlates real-time AIS data with external factors such as weather to predict delays. Risk scoring flags high-risk containers and bottlenecks like missed transshipments before they happen.
Act from the dashboard
The Fleet Health Grid shows the status of every tracked container in real time and is connected to operational tools: users trigger recommended actions such as "Optimise route" or "Notify customers" directly.
Outcome
Real-time data integrity alerts and automated anomaly detection across the whole fleet.
Results
- 37.6k containers tracked across the global network in real time.
- 2.55k orders recovered and validated.
- ETA deviation analysis runs automatically for every route.
Start with
Fixed scope, fixed price
AI readiness assessment
Which AI use cases pay off for you, and is your data ready for them? A ranked shortlist, an architecture and a roadmap.
From
€6,000net
Duration: 3 weeks
Who leads it: A senior data architect together with an AI engineer who has deployed models in production. You talk to the people who would build the solution.
Order the assessmentServices:Data foundation for AIAI engineering into production
Related case studies
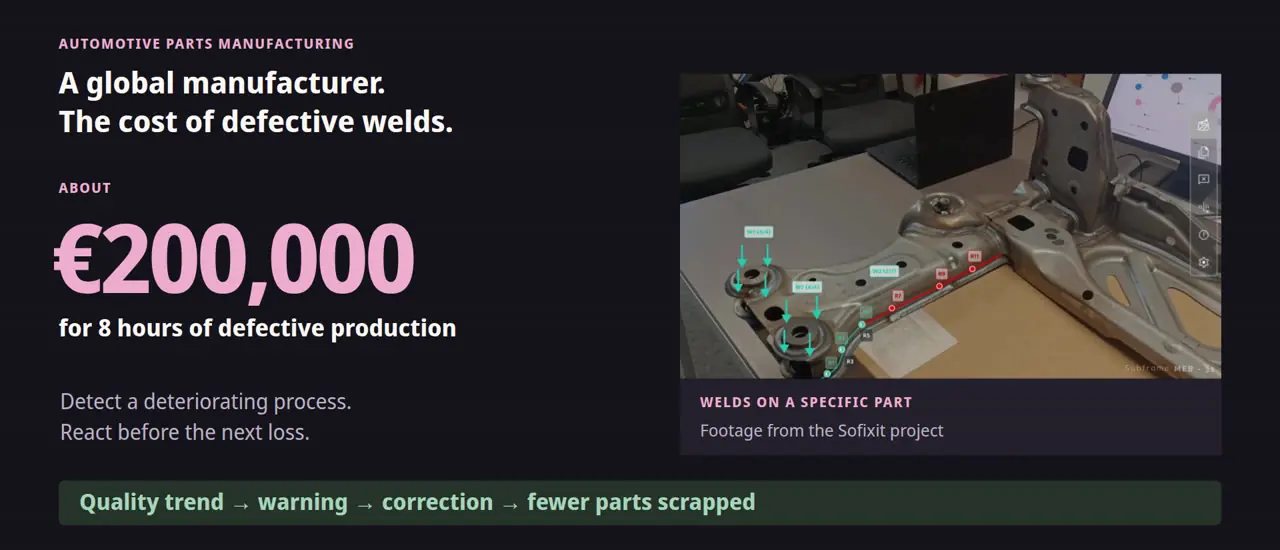
Weld quality AI: 86% fewer defective parts
Global automotive parts manufacturer · Automotive, metal components
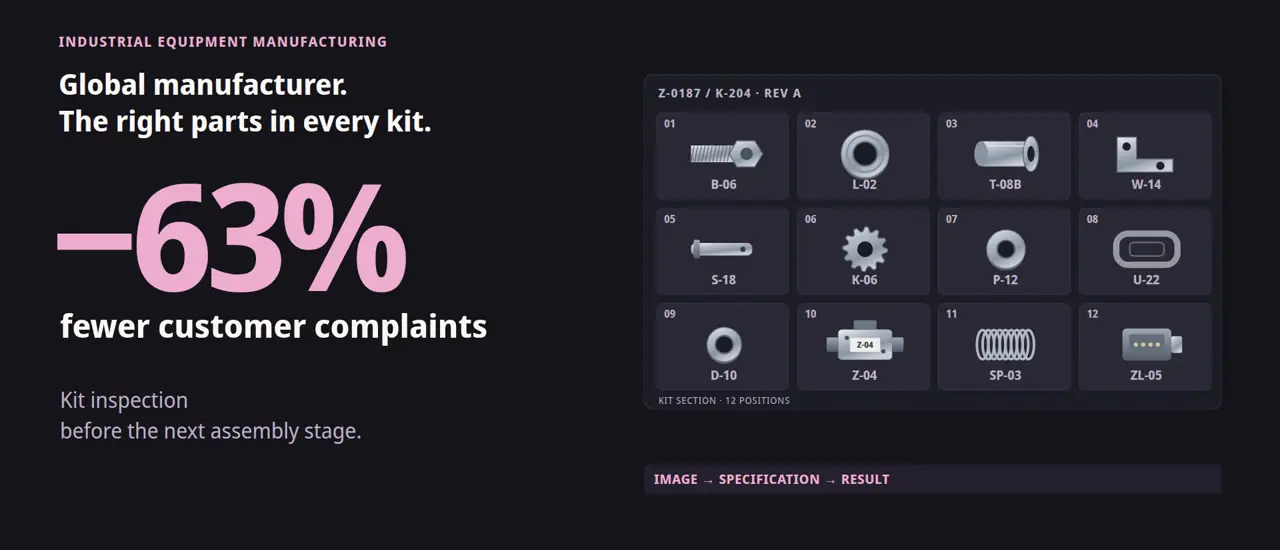
Kit inspection with computer vision: 63% fewer complaints
Global manufacturer of industrial equipment · Industrial equipment manufacturing
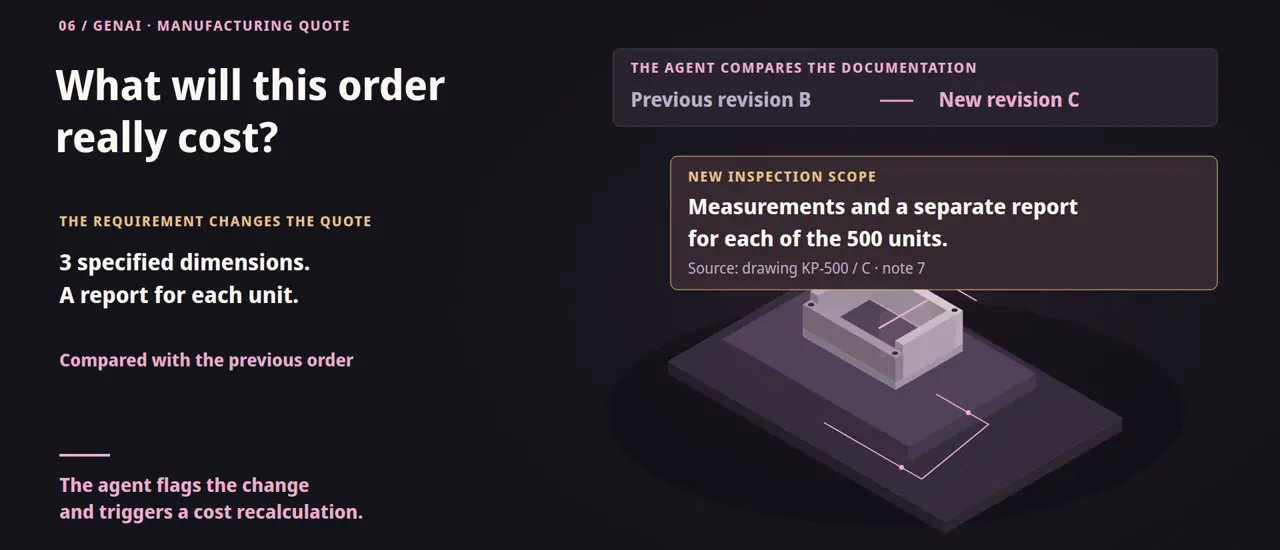
GenAI quoting agent: from 4 to 6 hours to 15 minutes
Manufacturing company · Manufacturing
Let's talk about your project
Tell us about your case
Pick one problem.
Show us the data you have.
Let's agree a measurable goal.
Name the process and the data you have. An engineer, not a call centre, gets back to you.
We reply within one business day.